

Advanced Analytics
Comprehensive insights across all operations
Total Revenue, Revenue per Mile, Avg Miles per Load, and best vs. worst performers across drivers, trucks, dispatchers, and pickup states. Auto-refreshing every 5 minutes.
Every view your team needs, on one dashboard
Switch between Overview, Truck, Driver, Dispatcher, and Company performance without leaving the page. Every metric stays in sync.
Overview
Total Revenue, Revenue per Mile, and Avg Miles per Load at the top of the dashboard. The three numbers that tell you how the company is really doing.
Truck Performance
See which trucks are pulling their weight and which are bleeding margin. Best and worst performing trucks ranked by revenue and utilization.
Driver Performance
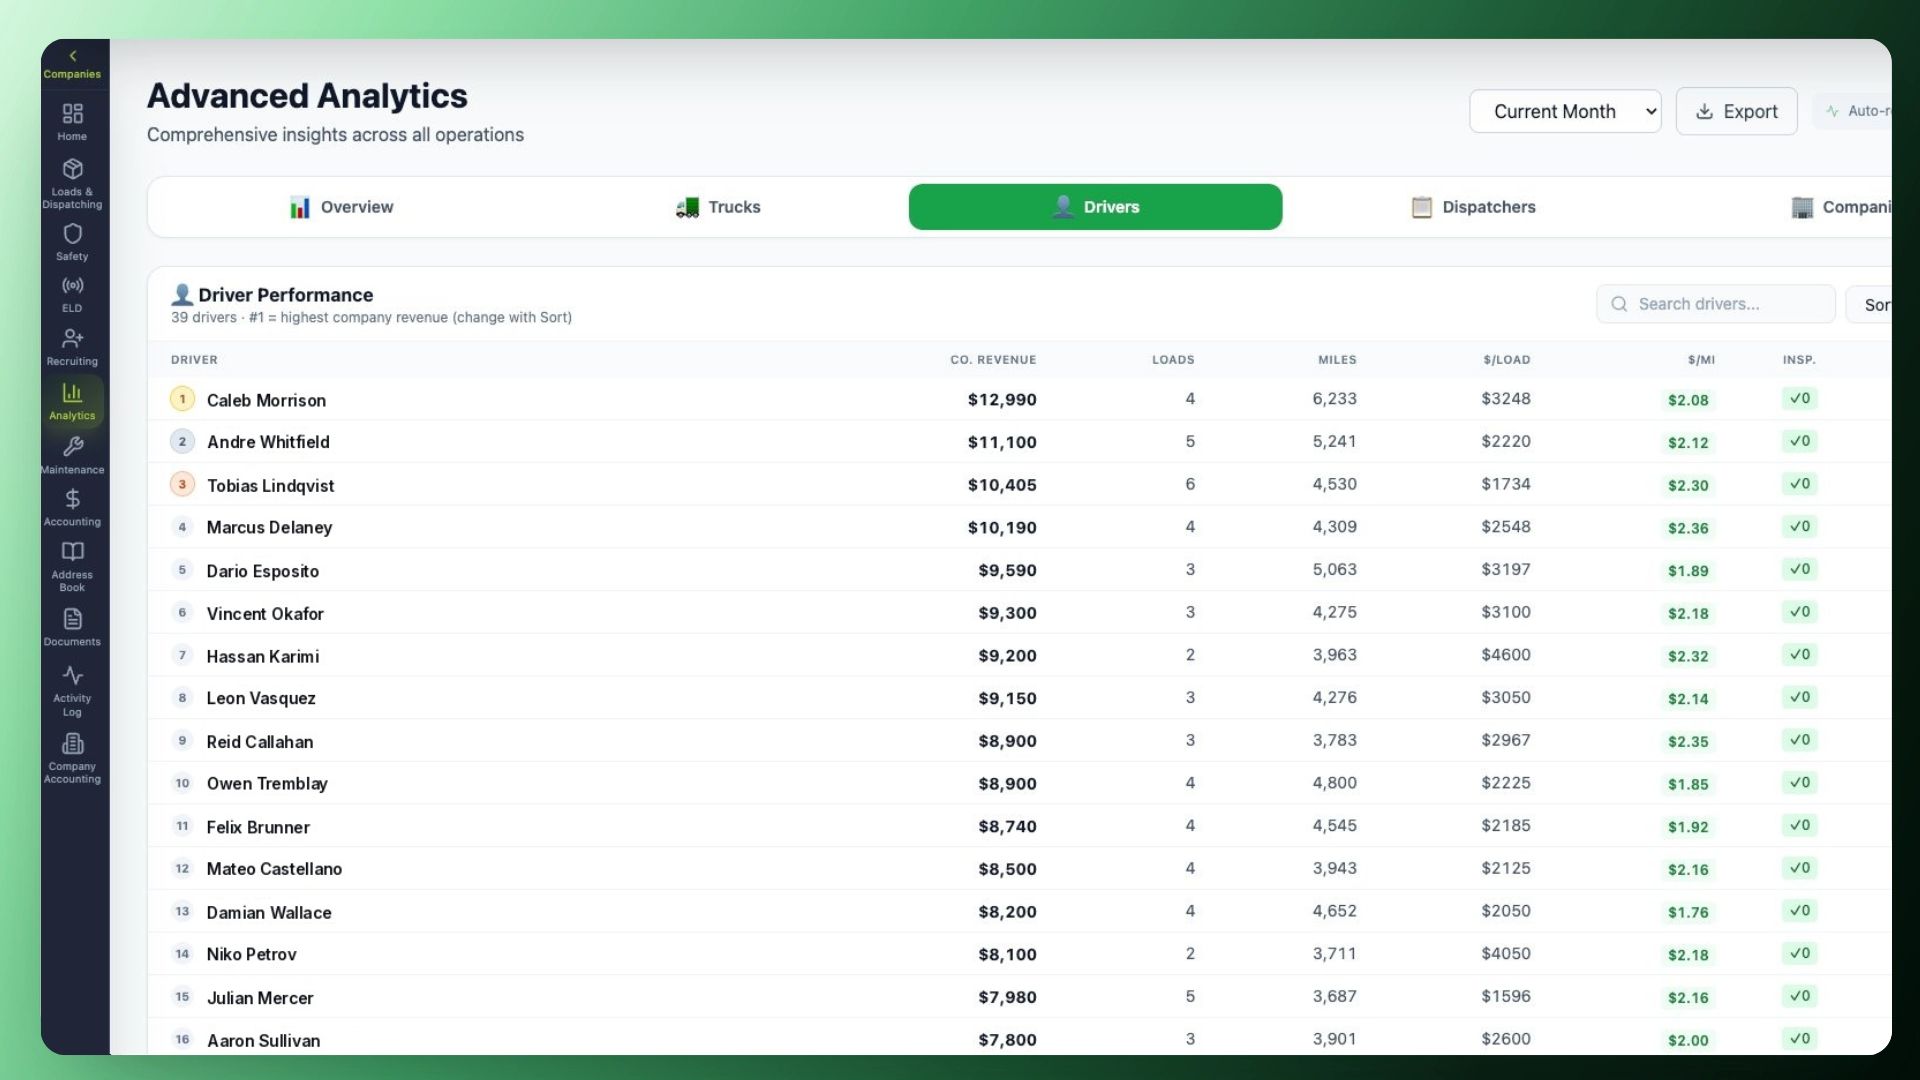
Rank every driver by revenue, miles driven, and revenue per mile. Spot top earners and identify drivers who need coaching.
Dispatcher Performance
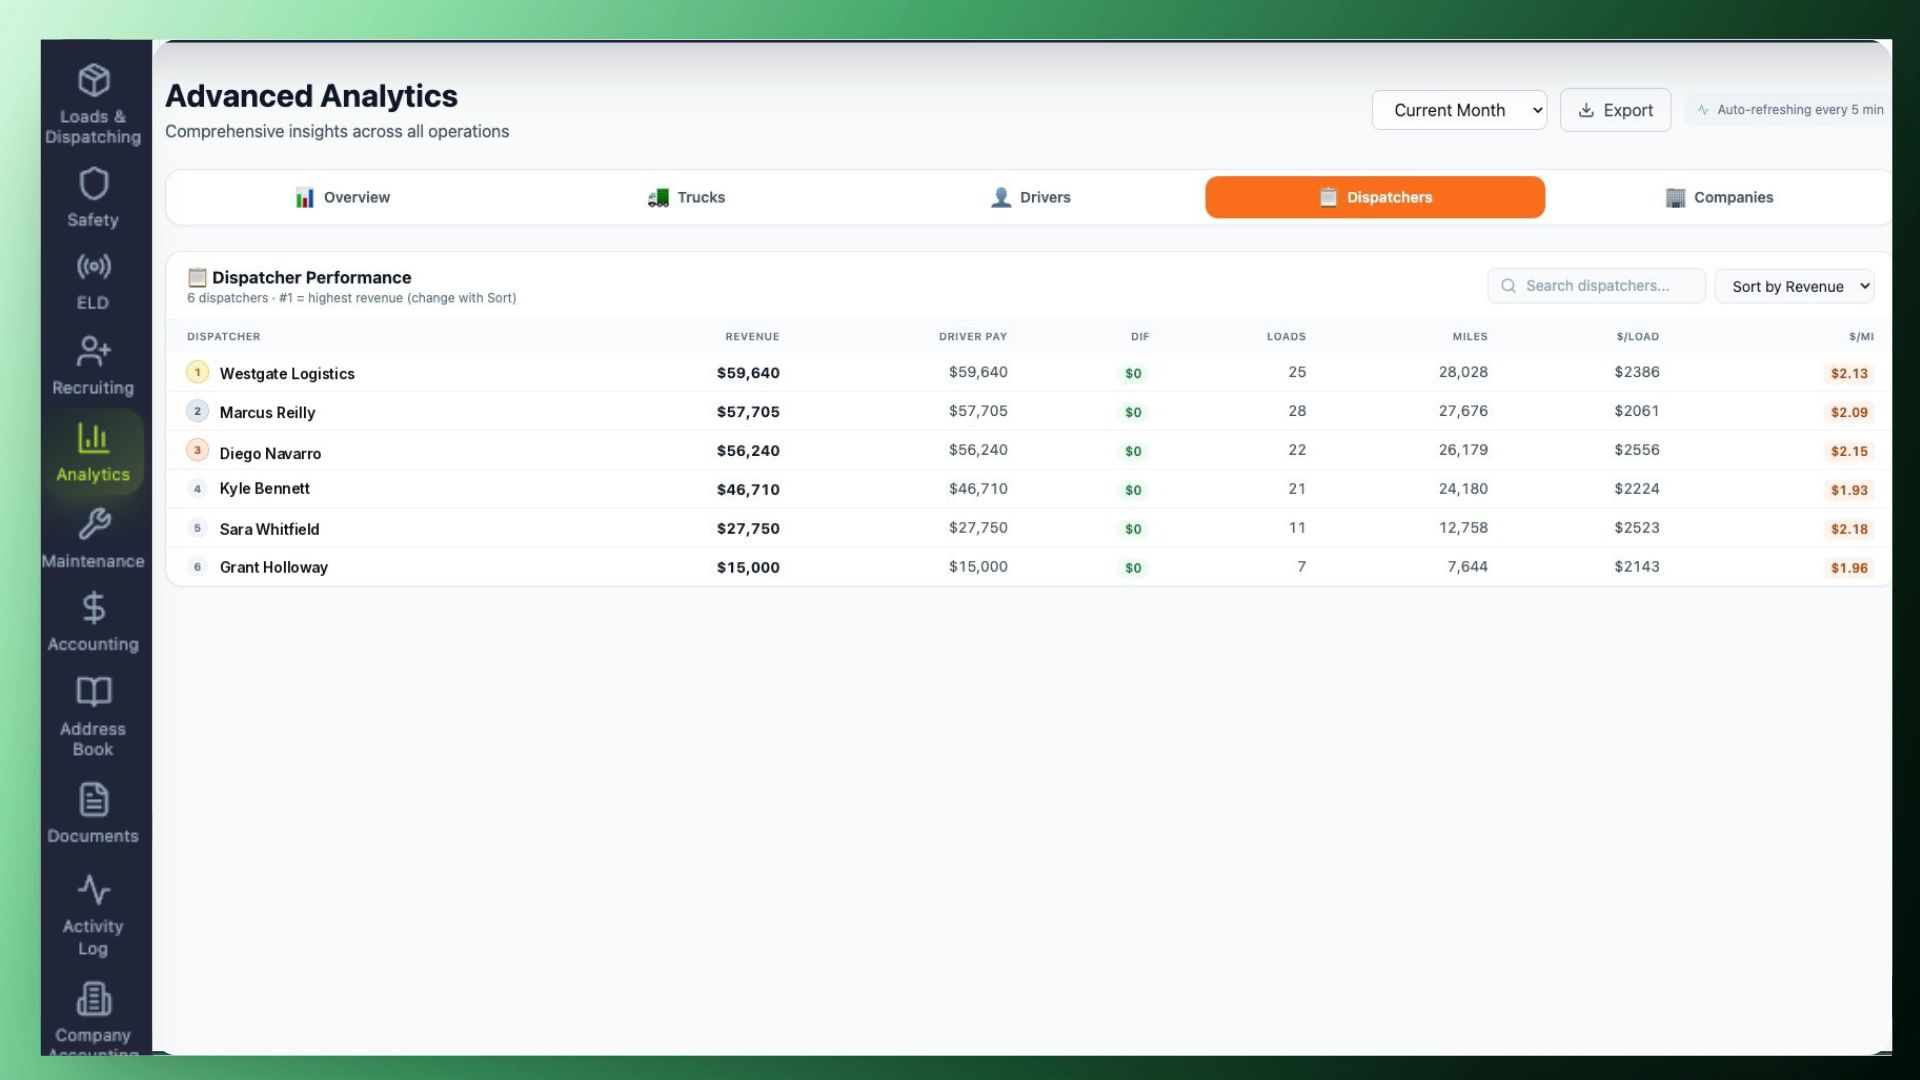
Track your top performing dispatcher. Loads booked, revenue generated, and revenue per mile per dispatcher in one view.
Company Performance
Roll everything up to the company level. Best and worst pickup states, lane profitability, and revenue trends month over month.
Revenue Insights
A transparent revenue sheet that replaces scattered spreadsheets. Every dollar accounted for, by truck, driver, dispatcher, and state.
Top-line KPIs at the top of every dashboard
No digging through tabs or exporting CSVs. The metrics that move the business are always one glance away.
Total Revenue
Year to date, quarter, month, or custom range, totaled live from delivered loads.
Revenue / Mile
The single most important profitability metric, calculated across your entire fleet.
Avg Miles / Load
Spot lane bloat and dead-mile creep before they eat into your margin.
Get 100% insight into your company performance and finances in one dashboard
Forget spreadsheets and untracked revenue. Everything in one place.
One dashboard. Total Revenue, Revenue per Mile, Avg Miles per Load.
Open the Overview tab and the entire company snaps into focus. Year-to-date totals, period comparisons, and the three KPIs that drive every profitability conversation, at the top, always.
- Year to Date, Quarter, Month, or custom date ranges
- Auto-refreshing every 5 minutes, never stale
- Export any view to CSV or PDF in one click
- Trend lines on every metric so direction is obvious
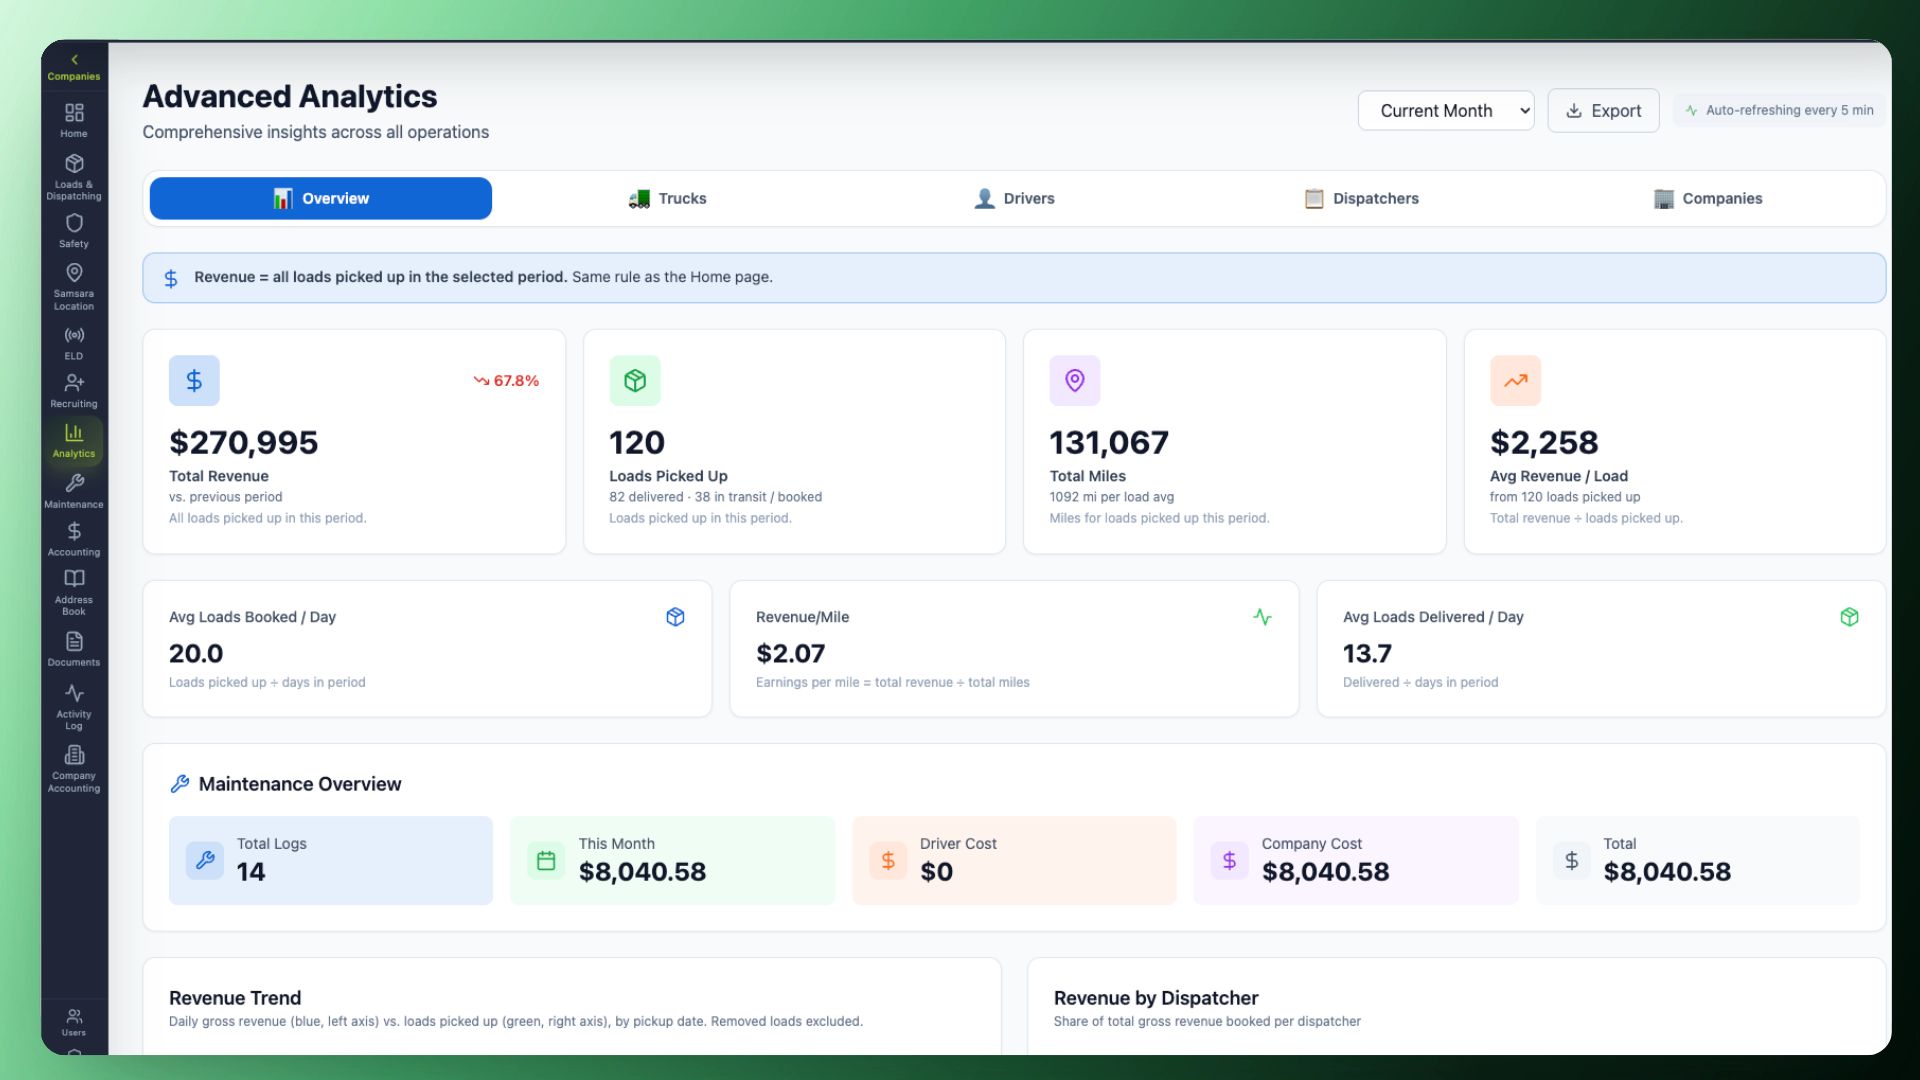
See best and worst performing trucks at a glance
Every truck ranked by revenue, revenue per mile, and utilization. Identify the trucks earning their keep and the ones quietly eating into your margin, then act before the quarter closes.
- Top and bottom truck rankings updated live
- Revenue, miles, and revenue per mile per asset
- Maintenance and downtime context inline
- Drill into any truck to see every load it ran
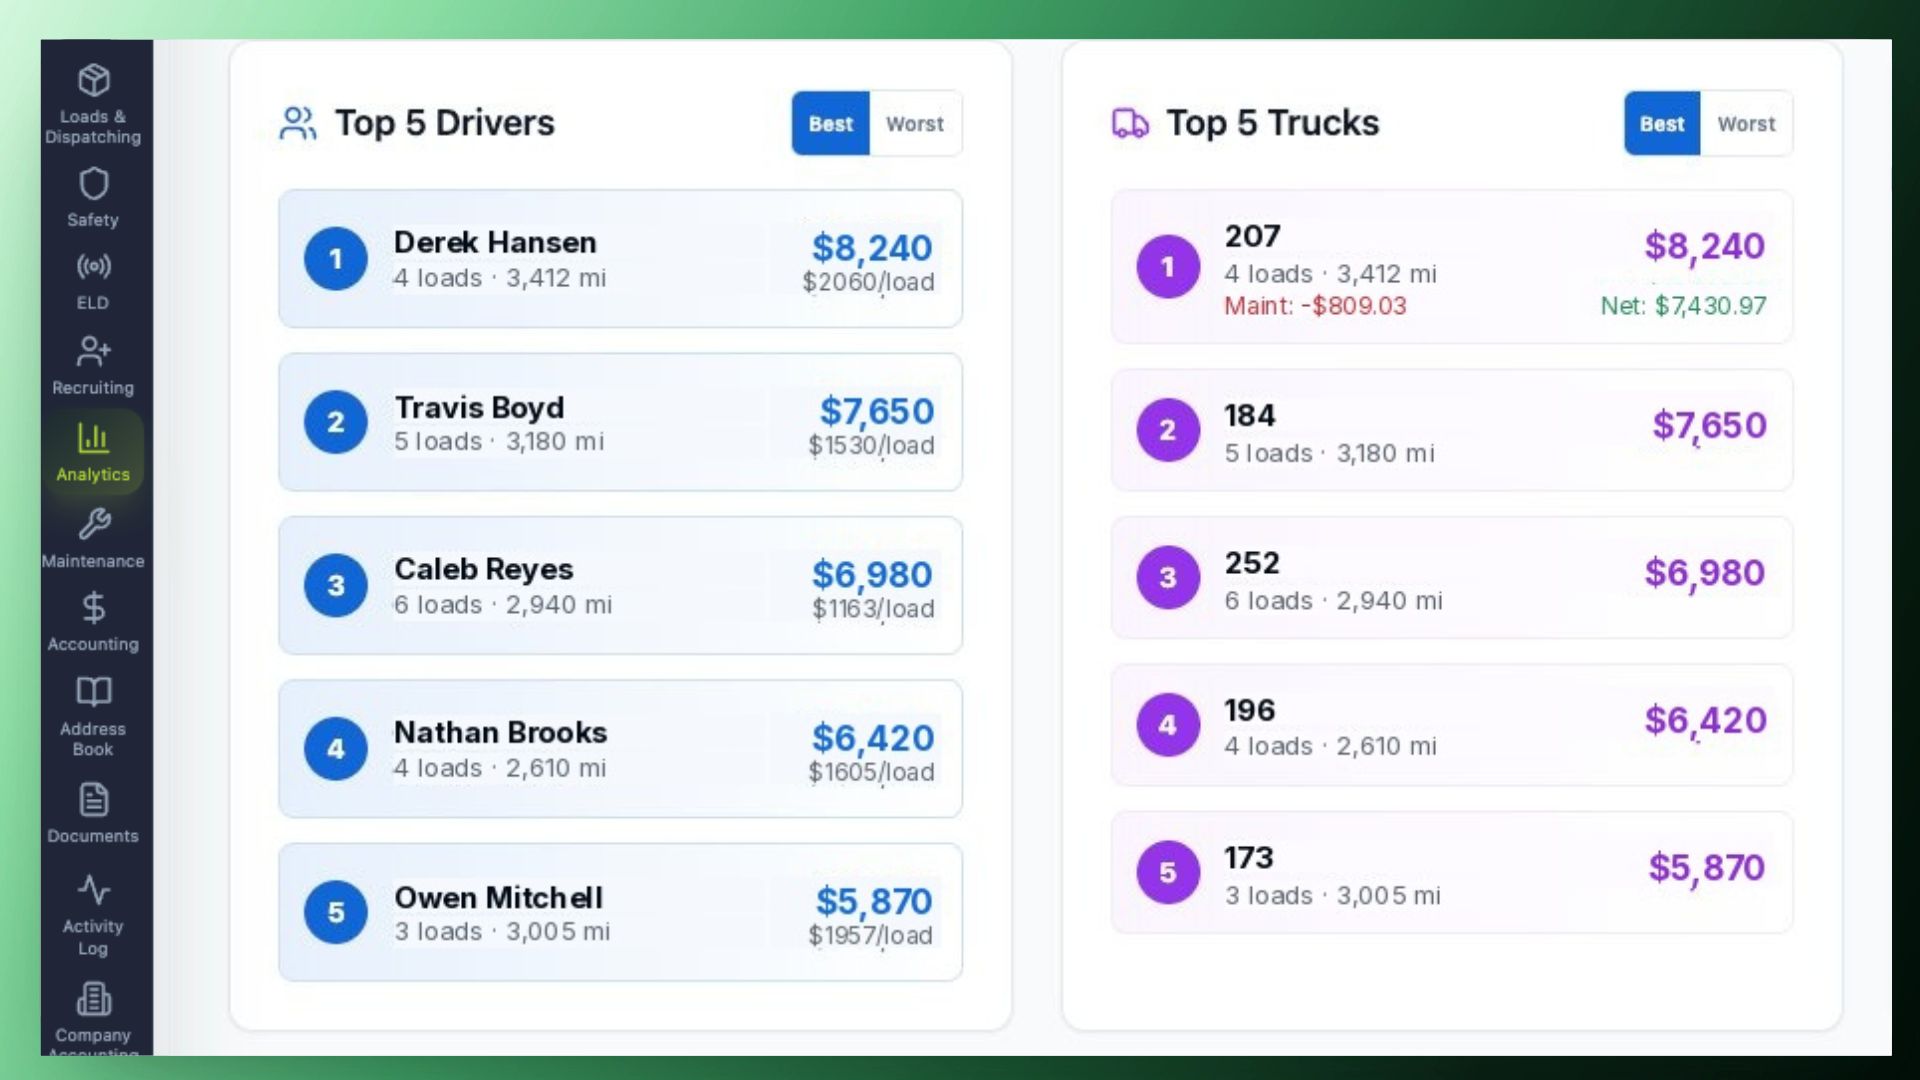
Reward your top earners. Coach the ones who need it.
Driver leaderboards built from delivered load data, not gut feel. Sort by revenue, miles, or revenue per mile. The Best and Worst lists are surfaced automatically, every refresh.
- Best and worst performing drivers, ranked automatically
- Revenue per mile per driver for fair comparisons
- Loads completed, miles driven, deadhead percentage
- Settlement-ready exports for your payroll team
Know your top performing dispatcher
Every load is tied to the dispatcher who booked it. See who is moving the needle on revenue, who is keeping trucks loaded, and who needs help, without manually building reports.
- Top performing dispatcher surfaced on the dashboard
- Loads booked, revenue, and revenue per mile per dispatcher
- Compare any two dispatchers head to head
- Period comparisons so growth is measurable
Best and worst pickup states. Lane profitability. The whole company.
Roll every load up to the company level. The Company Performance view shows the best and worst pickup states, lane profitability, and revenue trends. The strategic view owners actually want.
- Best and worst pickup states ranked by revenue per mile
- Lane-level profitability across origins and destinations
- Month-over-month and year-over-year comparisons
- Customer mix and revenue concentration
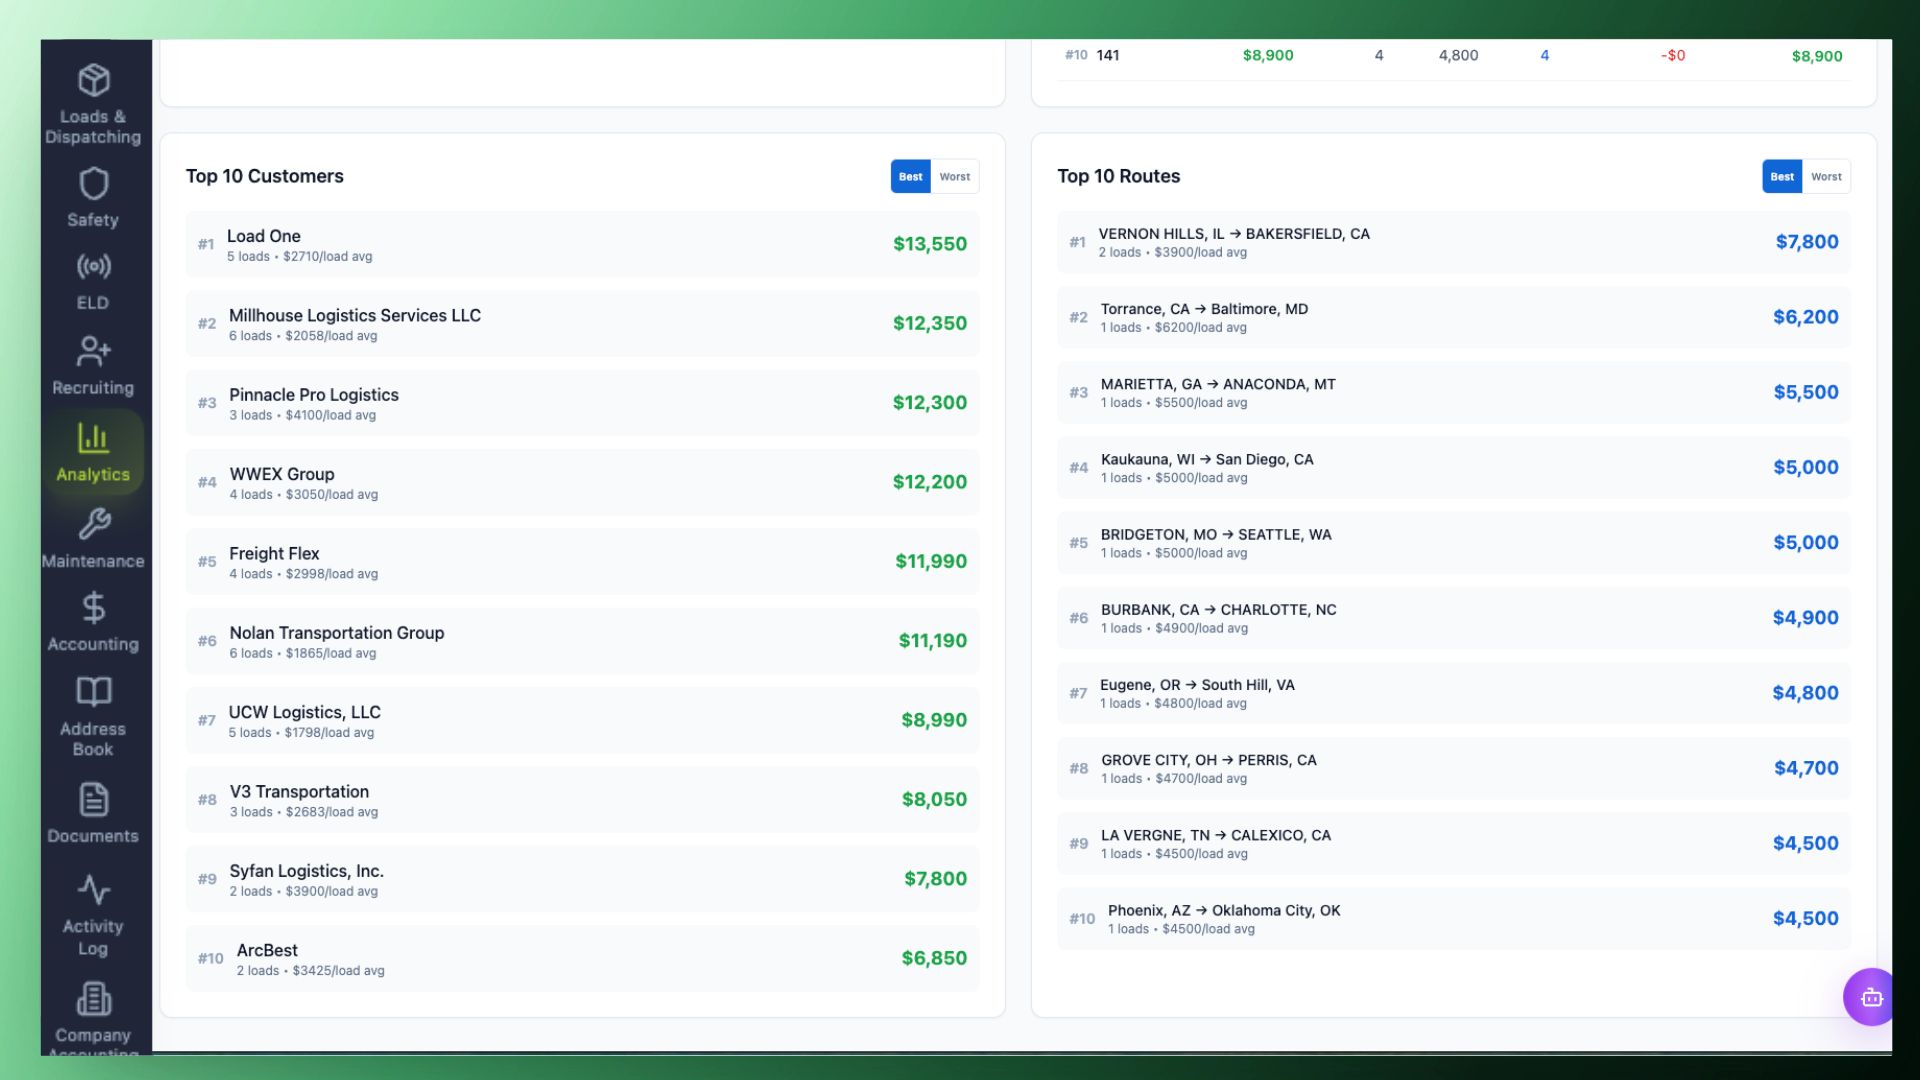
All in one place
Forget spreadsheets. Forget untracked revenue.
Get 100% insight into your company performance and finances from one easy dashboard. Total revenue, revenue per mile, miles per load, best and worst performers across every dimension, auto-refreshing every five minutes, no manual exports, no broken formulas.
See more features
Loadera connects every part of a trucking back office. Take a look at the rest of the platform.
Loads & Dispatching
AI rate confirmations, modern dispatch board, and live load tracking.
Accounting & Invoicing
Fuel and toll imports, driver statements, weekly payments, and factoring.
Safety Management
Drivers, trucks, trailers, inspections, and claims in one safety hub.
ELD Integration
Live truck locations and HOS compliance from any ELD provider.
Recruiting
Daily CRM, leads, arrivals, and reimbursements in one workflow.
Advanced Analytics
Total revenue, revenue per mile, and best vs. worst performers.
Maintenance
Maintenance logs, AI invoice parser, tire map, photos, and cleaning.
Address Book
Customers, facility locations, factoring companies, and service providers.
Company Documents
Private, secured vault for statements, CDLs, contracts, and company files.
Activity Logs
Monitor every user action and system event across your company.
Company Accounting
Company expenses, truck purchases, IFTA, and 1099-NEC generation.
Advanced AI Chatbot
A personal AI assistant trained on your loads, finances, dispatch, and fleet data.
Run your fleet on numbers, not gut feel
Advanced Analytics turns every delivered load into the insight you need to grow margin, reward top performers, and stop guessing.